

Quantifying the value of better legal representation
Some lawyers are better than others and quality matters. Intuitively, this makes sense — the job of a lawyer is to persuade, which is part legal reasoning and part hard work. Since the ability to persuade directly affects litigation outcomes, participants are willing to pay highly regarded barristers upwards of $28,000 a day, and some law firm partners an hourly rate of over $1,000. In this post, we analyse data from 22,000 cases to measure the differential impact law firms and barristers have on litigation outcomes.
By applying machine learning algorithms to data mined from court judgments, we find:
- large measurable differences in expected performance; and
- huge room for improvement in the selection of legal representation.
Litigants can increase their chances of a successful litigation outcome by over 25 per cent on average by switching to better legal representation. Bumping the chances of a successful outcome by 25 percent may very well be the difference between winning and losing.
Further, Chambers and The Legal 500 rankings are weakly correlated with litigation performance.
What is a useful metric to assess the expected performance of legal representation? Intuitively, having better legal representation should lead to a greater proportion of successful litigation outcomes. This points to the strategy of counting successful litigation outcomes. But measuring outcomes without accounting for the difficulty or context of the case is naive. For example, a barrister that takes the easiest cases will have a large proportion of successful outcomes and incorrectly be deemed a high performer. Secondly, litigation outcomes have a random component, outside of the control of even the best legal representation. Hence we should assess expected outcomes, instead of the random realization of outcomes.
To sidestep the randomness of observed outcomes, we focus on modeling the probability of a successful outcome for a given case. Secondly, to account for the context or difficulty of the case, we measure the change in the probability of a successful litigation outcome, from substituting a legal service provider in. The difficulty of the case is not important, but rather the impact a legal service provider has on that original probability of success. From now on, we will refer to this measure as the impact on expected performance. This substitution exercise is known as a counterfactual, as we apply the substitutions to historical data. We identify the set of better firms and barristers, for a given case, by finding those that have positive impacts on expected outcomes.
The difficulty in performing this counterfactual exercise is that many firms and barristers may have only faced a small set of other firms and barristers in previous litigation. We would like to evaluate how A would fare against B, even though we never observe a litigation matter between them. Similarly, if A is only involved in cases against the best opponents, we need to ensure we do not falsely conclude that A is below average.
Key to resolving these concerns is the fact that although many firms and barristers have not faced each other directly, they often have indirect connections to other firms and barristers via sequences of cases. Although A has not faced B, if both have faced C, then we have some information about the hypothetical A and B matchup. This is the same reasoning that allows one to compare tennis players across different eras. Although Sampras never played Djokovic, both of them played Federer. Their performances against Federer provide some guidance to how they would fare against each other. Similarly, even if Bret Walker SC only faces the best barristers, if some of these best barristers face more mediocre opposition, then we can infer how Bret Walker SC would fare against the broader set of opponents.
Methodology
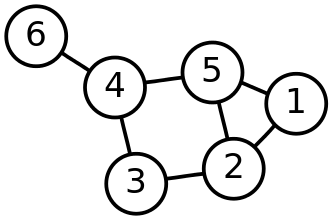
Figure 1: Example of Simple Graph
To quantify the connectedness of Australian firms and barristers, we use tools from graph theory. We construct a graph as follows. Each barrister and firm is a node. There exists an edge (or link) between two nodes if the two nodes have directly faced other in court. Define a path as a sequence of edges (or cases) that connects two nodes. See Figure 1 for an example of a simple graph. Ensuring that firms and barristers are comparable is equivalent to ensuring that the litigation graph is sufficiently connected, or that there are enough paths, of short length, between litigation participants. For example, the shortest path, of length 2, that connects Sampras to Djokovic consists of the matches between Sampras-Federer, and the edges between Federer-Djokovic.

Figure 2: Law firms and barristers are densely connected via previous litigation
We can measure the connectedness of Australian litigation participants by (i) looking for the largest connected sub-graph (group of nodes such that there exist paths between any two nodes in the sub-graph) and (ii) calculating the average path length within that largest sub-graph. A remarkable 81% of the law firms and barristers in our dataset are connected, with a median distance of 3 cases between them. Figure 2 shows the Australian litigation graph with nodes coloured red and edges in blue. The denseness of the graph indicates that a large number of firms and barristers can be compared, beyond those that directly faced each other in court.
For each of the roughly 22,000 cases in our dataset, we perform the following counterfactual exercise. First, we calculate the probability of a successful outcome for the applicant, given the original lineup of firms and barristers, using a machine learning model designed for counterfactual inference. Second, we construct a set of alternative firms and barristers that meet the following criteria:
- at least 5 appearances in the same court and area of law; and
- the shortest path between the opponents and the firm or barrister is less than 3 cases.
Finally, we substitute each of these alternatives in for each of the original firms and barristers and measure the change in the estimated probability of a successful outcome.
Results
Large differences in expected performance
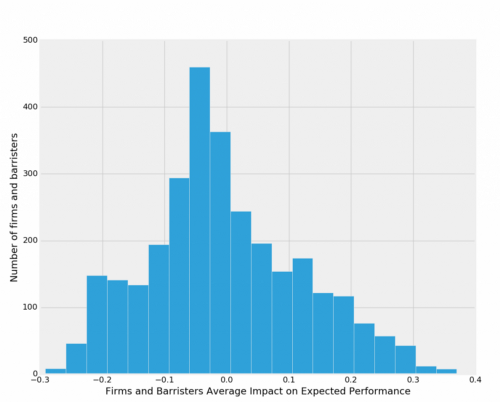
Figure 3: Range of avg. impact on expected performance across all firms and barristers
Figure 3 shows the distribution of the average impact on expected performance for each firm and barrister. The distribution is symmetric around 0, indicating that the median firm or barrister has little impact. However, the standard deviation of the average impact is 0.12, indicating a big difference between good and bad legal representation. To put this in perspective, consider that the average probability of a successful outcome is 0.5, a coin flip, as litigation is largely zero-sum.
Current selection of legal representation is sub-optimal
Given the large difference in expected performance of firms and barristers, how well do litigants select legal representation? The good news is that on average, litigants choose close to the median performing legal representation. The bad news is that this is far from optimal. By choosing the median better legal representation, litigants can improve their chances of a successful litigation outcome by 13.7 percentage points.
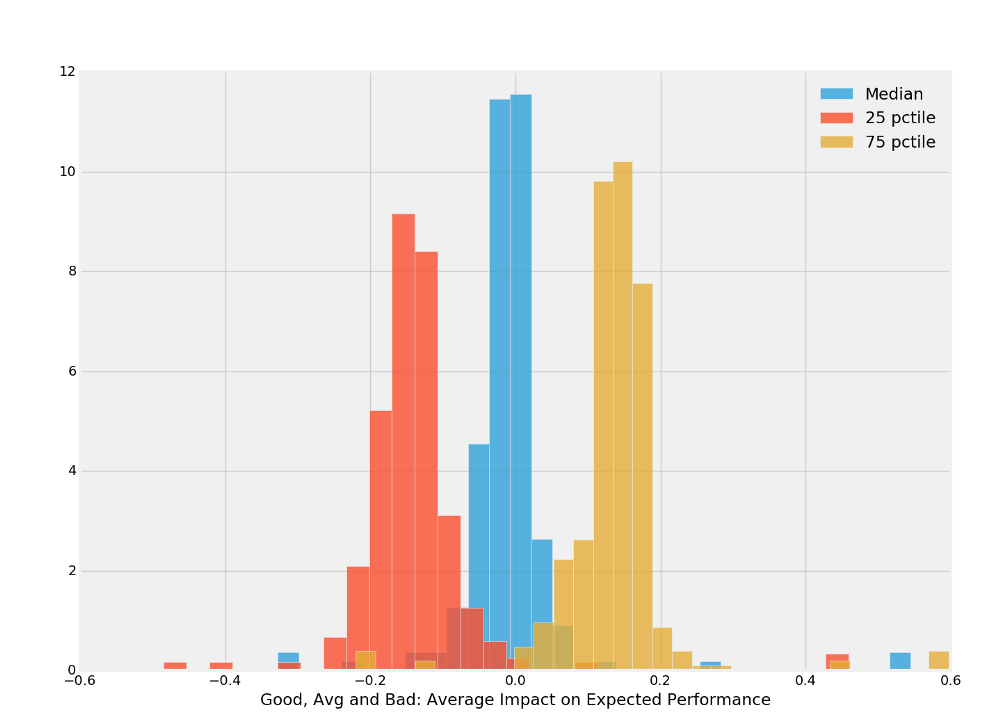
Figure 4: Returns to better legal representation (25th, 50th and 75th percentile impacts)
We can assess the returns to better legal representation by finding the 25th, 50th and 75th percentile impact on expected performance, separately for each case. These percentiles can be interpreted as the expected impact for poor, average and better legal representation. Furthermore, to neutralize effects from different areas of law and courts, we average these percentiles across court-area of law pairs. The figure above shows a histogram of the results. For example, the yellow portion of the chart shows the average impact “better” legal representation would have, for each court-area of law pair.
As stated earlier, choosing the median legal representation on mostly has little impact, since litigants currently choose the median legal representation. However, there are big consequences of choosing better or worse legal representation. The average impact for better legal representation is +13.7 and for worse legal representation, it’s -13.9 percentage points. As the probability of success is 50 per cent (litigation is zero-sum), this represents a return to better legal representation of 27.5 per cent if one is currently choosing the median legal representation.
Why are litigants unable to select optimal legal representation on their own? This is a topic we will discuss in a later post, but it’s due to a lack of expertise, bias in favor of familiarity or reputation (whether conscious or unconscious) and the agency costs associated with the person selecting having competing interests.
Returns to legal representation vary across areas of law
Returns to better legal representation also vary between areas of law. Better legal representation in a case categorized as Social Services improves the probability of a successful outcome by only 6.3 percentage points compared to 17.8 percentage points in a Taxation case. The areas where legal representation matter least are areas where the federal government is heavily involved: Social Security, Defence and War and Human Rights.
Existing rankings are weakly correlated with expected performance
It is important to stress that finding better legal representation cannot be achieved by looking up the top performers in Chambers and Legal 500 rankings. For law firms, each step up in Chambers and Legal 500 tier is associated with a barely statistically significant 0.9 percentage point improvement. Overall, ranked law firms generate 2.5 percentage points more expected improvement compared to non-ranked firms. For barristers, Chambers and Legal 500 rankings are similarly uninformative. The average expected improvement from substituting in a Chambers top ranked barrister is 2.3 percentage points more than barristers who are not ranked. Keep in mind that switching to the median better firm and barrister leads to a 13.7 percentage point improvement.
All rankings are misleading
One reason why existing rankings are decoupled from expected performance is that they lean heavily on submissions by firms themselves, which are merely reflections of the ability of the marketing teams within firms. Better firms probably have better marketing teams but the reverse is unlikely to be true. Moreover, relying on marketing strength as an indicator of performance is not a sound strategy for litigation.
But even performance based rankings are flawed. The best legal counsel in a given situation depends on the context. Reducing firms and barristers to an ordinal number and falsely suggests that the ordering is sufficient to choose between legal representation.
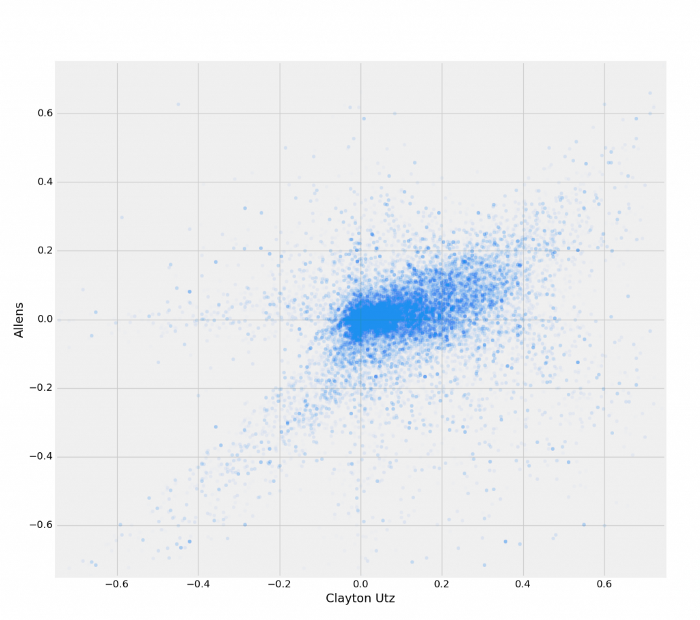
Figure 5: Comparison between Allens and Clayton Utz on same set of counterfactual cases
Consider choosing between Allens and Clayton Utz. We can use LitiPredict, our legal technology engine to directly compare Allens and Clayton Utz on cases where both firms are valid alternatives. Figure 5 plots Clayton Utz’s impact on expected performance against Allens’, for the same set of cases. Any sensible ranking would order Clayton Utz above Allens given that the average impact is greater for Clayton Utz. But this ranking is misleading, as Allens has a greater impact than Clayton Utz in approximately 30% of the cases. In other words, relying on the ranking would lead to suboptimal outcomes 30% of the time.
Conclusion
Large differences exist in expected performance, so it makes sense to rely on external guidance when choosing legal representation. Rankings are simple and satisfy our natural inclination to rank and order things. But litigation is complex. The simple fact is: existing rankings are poor indicators of performance. It is easy, but foolhardy to rely on rankings, as the basis of litigation strategy.
The current over-reliance on rankings or reputation presents an opportunity for first movers. By moving towards a data-driven litigation strategy backed by machine learning, parties can find better legal representation, improving the chances of successful litigation by more than 25 percent.